

Create accurate, publication-ready scientific figures and diagrams from a description.
Added: 10/7/2026
ExplainViz is an AI scientific figure maker that turns research findings, variables, theories, and abstracts into editable, publication-ready diagrams and posts
Overview
Overview
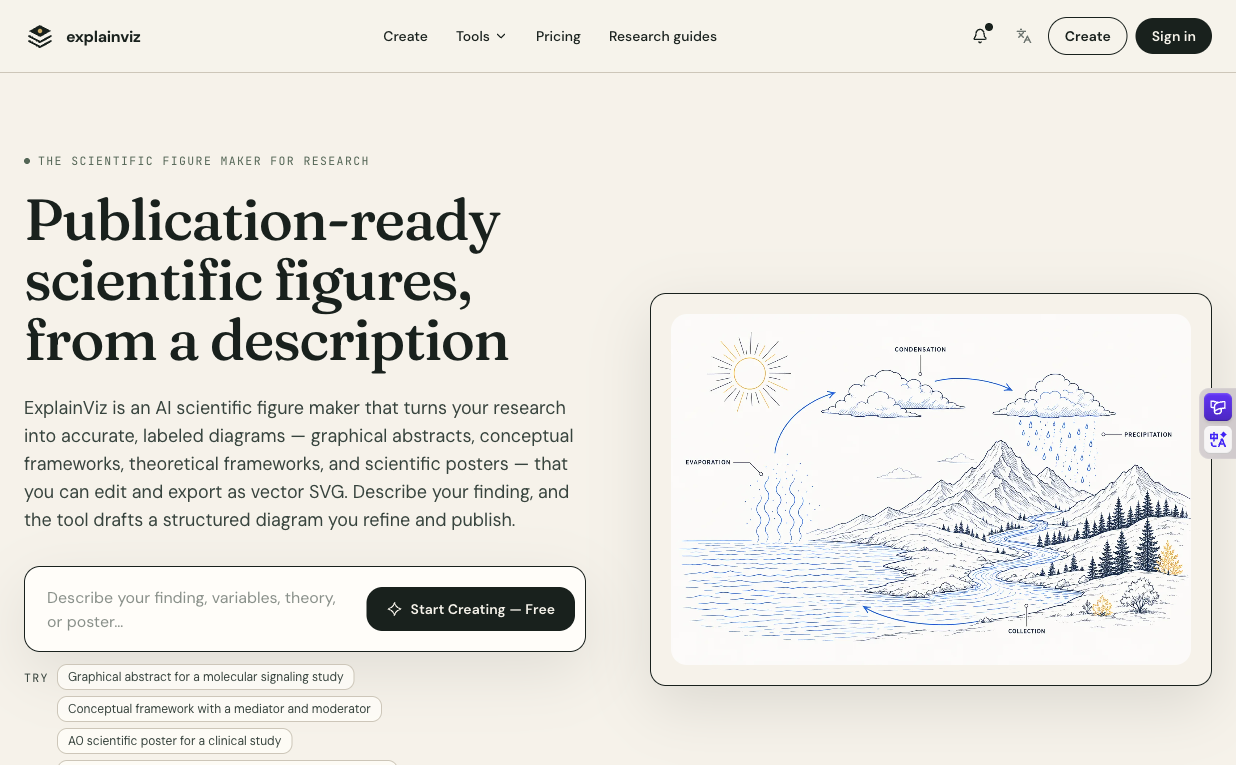
ExplainViz is an AI scientific figure and diagram maker designed for research and academic workflows. It turns a description of a finding, a set of variables, a theory, a mechanism, or a conference submission into structured, labeled scientific figures. Instead of generating uneditable decorative images, ExplainViz drafts publication-ready diagrams such as graphical abstracts, conceptual frameworks, theoretical frameworks, scientific illustrations, and scientific posters. Users can review, refine, and export figures as vector SVG or high-resolution output sized for journals and conferences.
Key Features
- AI scientific figure generation from a plain-language description, abstract, variables, theory, or study summary.
- Specialized tools for different research outputs: Graphical Abstract Maker, Conceptual Framework Generator, Theoretical Framework Generator, Scientific Illustration Generator, and Scientific Poster Generator.
- Publication-ready output with accurate, reviewable labels, directional arrows, and logical layout.
- Editable SVG export designed for Adobe Illustrator and similar vector-editing workflows.
- Journal-spec sizing support for major publishers such as Elsevier, Wiley, and Cell Press.
- No watermark on exported figures.
- Review-and-revise workflow: users can adjust labels, relationships, layout, colors, and typography while keeping scientific judgment in their hands.
- High-resolution output sized for target journals, conferences, posters, and presentations.
- Prompt examples include molecular signaling graphical abstracts, mediator/moderator conceptual frameworks, A0 clinical study posters, and photosynthesis light reactions in the thylakoid membrane.
- Free start option for creating scientific figures.
Target Users
- Researchers, academics, professors, postdocs, and PhD students preparing journal papers.
- Authors who need graphical abstracts and scientific figures that remain editable through peer review.
- Thesis and dissertation writers creating conceptual or theoretical frameworks.
- Conference presenters and grant applicants producing scientific posters and research visuals.
- Educators and teachers who need accurate, labeled scientific illustrations, such as animal cell or photosynthesis diagrams.
- Research teams that want consistent, professional, and editable scientific diagrams without starting from scratch in design software.
Unique Selling Points
- Built specifically for scientific figure types and academic workflows, not generic AI image generation.
- Produces structured, labeled, reviewable diagrams rather than uneditable decorative images.
- Exports editable SVG, which is essential for journal revisions, Illustrator editing, and long-term figure maintenance.
- Supports journal-spec dimensions and publisher requirements, reducing manual resizing and formatting work.
- Keeps scientific judgment with the researcher while automating layout, labels, and sizing for the first structured draft.
- No watermark, making outputs more suitable for publication and presentation use.
- Covers multiple research outputs in one workspace: graphical abstracts, conceptual frameworks, theoretical frameworks, scientific illustrations, and posters.
Pros and Cons
Pros
- Speeds up the first draft of publication-ready scientific figures from a simple description.
- Produces editable SVG output, so figures can be refined in Illustrator or other vector tools.
- Designed around scientific accuracy, labels, and relationships rather than purely aesthetic image generation.
- Supports multiple specialized research figure types in one platform.
- Journal-spec sizing and no watermark make it more practical for real publication workflows.
- Useful for papers, theses, posters, grants, and educational scientific illustrations.
Cons
- AI-generated scientific content still requires expert review for accuracy before submission.
- Results depend heavily on how specific and detailed the initial description is.
- Best suited for structured scientific diagrams, not photorealistic or artistic imagery.
- Journal-specific formatting rules may still require manual final checks.
- As a web-based tool, it may not suit users who need a fully offline or desktop-only workflow.
Top Features
- AI-generated graphical abstracts, conceptual frameworks, theoretical frameworks, scientific illustrations, and posters
- Editable SVG export for Illustrator and vector-editing workflows
- Journal-spec sizing for publishers such as Elsevier, Wiley, and Cell Press
FAQ
Traffic Analysis
Monthly Visits
--
Avg. Duration
--
Global Rank
--
Bounce Rate
--
Alternatives to ExplainViz

Notify Sound
A free library of editable notification sounds — dings, chimes, pops and alerts — that you customize with an AI agent in-browser.

FloorPlanBot
AI floor plan generator that turns written room briefs into editable 2D house layout concepts with PNG, PDF, and schematic DXF exports.

ToolSift
Discover verified, curated tools for developers and creators across AI, SEO, design, marketing, and other build-and-ship categories.

BabyShower AI Planner
Snap a photo of your room to get AI-generated baby shower themes tailored to your space, lighting, and budget, with free previews.

Bonsivo
Bonsivo analyzes your tree's structure to generate multiple potential styling directions, helping you make informed decisions before pruning.

FondPix
FondPix is an AI wedding photo generator that turns your casual couple photos into realistic bridal portraits across 200+ styles and scenes.

ClipLumi
ClipLumi is an AI photo editor that allows you to transform images with text prompts, reference images, and granular control over output settings.

remover.work
remover.work offers AI-powered tools to seamlessly remove unwanted elements like backgrounds, subtitles, watermarks, and objects from videos and images.